
If you work with data as a journalist, it won’t be long before you come across the phrases “dirty data” or “clean data”. These terms cover a wide range of issues and various techniques to address them, so in this post I’ll examine exactly what makes data “dirty” and the different cleaning strategies a journalist might use to deal with it.
Summary
Four categories of issues with dirty data
Look up definitions of dirty data and you’ll find the same three words: inaccurate, incomplete or inconsistent.
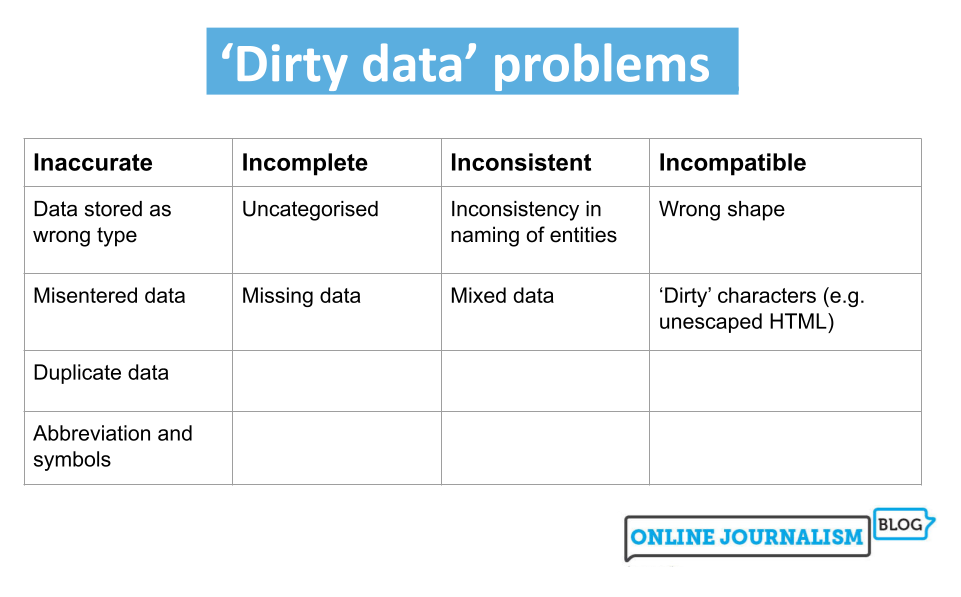
Inaccurate data includes information that is duplicated or entered incorrectly or data stored with the wrong data type.
Incomplete data may only cover certain time periods, areas, or specific categories, or may lack categorization entirely.
Inconsistent data may refer to the same entities in different ways or mix together different types of data.
To these three common terms I would also add a fourth: data that is simply incompatible with the questions or visualizations we want to perform with it. One of the most common cleaning tasks in data journalism, for example, is to “reshape” data from long to wide, or vice versa, so it can be aggregated or filtered by particular dimensions. (More on this later).
Detection and correction: wrong data type and incorrectly entered data
The first clue that you have dirty data is when it doesn’t appear or behave as you expect. Anyone importing stop and search data from the UK Police data portal into Excel, for example, might notice that one category in the age column shows up as “October-2017.” Why would that be an age category?

The answer is, it isn’t: Excel interprets “10-17” as a date. (In 2020, scientists even went so far as to rename human genes to avoid this common problem, which is estimated to have affected hundreds of research studies). Or you might try matching company numbers and discover that some do not work as they should.
This could be because codes like business numbers are often stored as numbers numeric by spreadsheets, resulting in any zeros at the beginning being dropped. Those zeros are important: a company number, it turns out, is not a number, but a code.
The problem in both cases is that the data is stored as the wrong type and this is something you should systematically check every time you import or open data by proceeding as follows:
- Look in each column to verify that all entries are aligned as you would expect. Excel will align numeric values (including dates) to the right and text to the left. If the data is not aligned as it should be (company numbers should be left-aligned and dates to the right), then you have dirty data.
- Sort the column (ascending and descending): text is sorted differently than numbers, so sorting will help surface any unexpected values. If you have a column with a mix of numbers and text, the numbers will be sorted before the text (and vice versa if you sort in descending order).
- Add a data validation column : functions like ISNUMBER and ISTEXT will return
TRUEorFALSEdepending on whether the specified cell contains that type of data: for example,=ISNUMBER(A2)will returnTRUEif A2 contains a number andFALSEif not. You can drag the formula down a new column to get a result for each cell in the neighboring column you’re checking. - Add a data measurement column : a useful one is the LEN function to tell you how many characters are in a cell (including spaces), allowing you to sort again by this to bring unexpectedly long or short data (such as inconsistent codes) to the top.
Sorting will help you gather all the dirty data together to clean it, either manually for a limited number of errors, or by using Find and Replace to clean up one or two errors on a larger scale or problematic characters like currency symbols. More complex problems might require creating formulas in the spreadsheet to, for example, replace missing zeros, substitute “thousand” with “000”, remove non-printable characters or convert date formats.
When sorting a column, also pay attention to numbers that are much larger or smaller than the rest that could realistically have been entered incorrectly (for example, a decimal digit is missing). In this case, you might contact the source to verify if the specific figure is correct.
Before correcting any dirty data, remember to format the data type of the entire column to prevent it from happening again: to do this, right-click the column and select Format cells. Then choose the appropriate data type.

Both Excel and Google Sheets have built-in tools to spot duplicate rows or values. The formatting button in Excel will highlight duplicates if you want to handle them individually or you can use the Remove Duplicates button in the Data panel to remove duplicate rows.
Google Sheets has similar formatting features, plus a new option for data cleaning (in the menu Data) which will remove duplicates.
Identifying and correcting inconsistent data
Sometimes, entities in a dataset are named inconsistently: a coffee shop might be called Starbucks in one row, but Starbucks Coffee in another, and Starbucks Coffee Ltd in yet another.
This can cause problems if we want to perform some sort of aggregated analysis that treats them all as the same entity (this issue often becomes obvious when creating a pivot table: entities with similar names will take up separate rows when we want them all counted together).
One of the best tools for tackling this problem is Open Refine and its “Cluster and Edit” tool: this groups similar entries in a column using one of several algorithms: you could ask it to group names that sound similar using the “phonetic fingerprint” algorithm, or words sharing most of the same characters using the “N-gram fingerprint” algorithm.
You don’t need to understand the algorithms: Open Refine presents you with the resulting clusters and you can choose to clean them so all entries within that cluster are the same, or leave them as they are.
An extra whitespace, for example, can cause your spreadsheet to treat two entities separately (because one has a space where the other does not). Google Sheets’ data cleaning suggestions will find and remove these for you.
Inconsistent use of capitalization is another common issue: this can be fixed with a new column that uses the PROPER or LOWER functions. These will take the formula’s content and format it consistently in the “proper” case (each word starts with a capital letter) or in lowercase. You can also solve other issues, such as using different words for the same thing (“&” versus “and”, for example, or “Ltd” versus “Limited”) with Find and Replace or with the SUBSTITUTE function.
Identifying and correcting mixed data
Another common problem encountered in datasets is when data is mixed together in the same column. Sometimes this is less obvious, like in the case of an address column mixing the street name with the city and zip code, while sometimes it is more evident, as when a column mixes general categories with subcategories.
Generally, you notice this when you want to analyze one aspect of the mixed data and have to separate it somehow to do so.
The “Text to Columns” button in Excel is particularly useful for splitting mixed data. This allows you to divide a column into multiple columns based on a specific “delimiter.”
For example, if a column always uses a comma after the street name and before the city name, you can use the Text to Columns wizard to use that comma as a “delimiter” to place them in separate columns. Similarly, if there’s a space between the first and second parts of a postcode, that space can be used as a delimiter with similar effects.
Some mixed data issues are so common that tools and code libraries have been developed specifically for them: Parserator is an online tool for “parsing” addresses into their individual components; whereas probabilipeople is a library Python for name analysis and humaniformat is an equivalent in R.
For bigger challenges, you might need the faceting and filtering functionality of Open Refine (this is particularly useful when categories and subcategories are mixed, for example).
Roberto Rocha reports an experiment where he tried using ChatGPT to clean data based on names which seems to work quite well. He also used ChatGPT to add missing data (company codes and categories; parent companies) with variable results.
Messy data
Poorly formatted spreadsheets are a particularly common challenge in data reporting. Governments are known for releasing spreadsheets where column headers are not in the first row, where the headers might span multiple rows, and where even header cells might be merged.
All of these factors can make it difficult or impossible to sort and filter the data, or to create new columns that can extract or validate such data.
A good rule of thumb when opening such a data set is:
- Make a copy of the spreadsheet
- Remove any rows before the column headers
- Remove all empty columns (Excel will treat them as the end of a table) and any columns you don’t need
- If the headers are spread over multiple rows or merged cells, create a “clean” header row so the header data is preserved, then delete the old rows/cells.
Open Refine is, once again, very useful for dealing with many of these issues. Its import wizard lets you specify whether you want to skip rows before the header row, whether you want to take headers from multiple rows, and whether to ignore empty rows.
Data in the “wrong” shape and the principles of “tidy data”

A slightly different issue occurs when data comes in the “wrong” shape. There are two main categories of shape problems: data is “long” when you want it “wide,” or vice versa.


